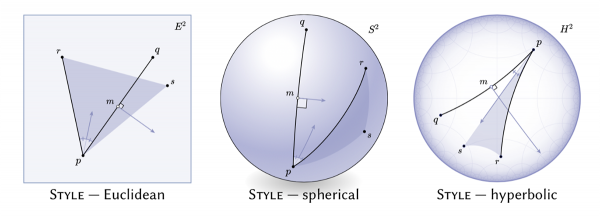
A tool from Carnegie Mellon University (CMU) called Penrose, can automatically convert mathematical expressions in to drawings. (Yes; it is indeed named after Roger Penrose.)
While a graphical calculator is able to map basic functions graphically, Penrose can draw relations more complex mathematical relations, according to the university.
Once the computer learns how the user wants to see mathematical objects visualized — a vector represented by a little arrow, for instance, or a point represented as a dot — it uses these rules to draw several candidate diagrams. The user can then select and edit the diagrams, says CMU.
“Some mathematicians have a talent for drawing beautiful diagrams by hand, but they vanish as soon as the chalkboard is erased,” said Keenan Crane, an assistant professor of computer science and robotics. “We want to make this expressive power available to anyone.”
The interdisciplinary team behind Penrose includes Katherine Ye, a Computer Science student at CMU, as well as Keenan Crane, an assistant professor of computer science and robotics at CMU; along with Nimo Ni and Jenna Wise, also students, in CMU’s Institute for Software Research (ISR); Jonathan Aldrich, a professor in ISR; Joshua Sunshine, an ISR senior research fellow; cognitive science undergraduate Max Krieger; and Dor Ma’ayan, a former master’s student at the Technion-Israel Institute of Technology.
The National Science Foundation, Defense Advanced Research Projects Agency, the Sloan Foundation, Microsoft Research and the Packard Foundation supported the research.
The Penrose code repository is available in GitHub, if you want to take a look.
[Image courtesy: CMU]
